

Multifamily
With high interest rates and economic uncertainty in the face of tech layoffs and bank failures, the San Jose multifamily market remains somewhat subdued. Hybrid working will remain a prevalent trend for Silicon Valley employers, and most employees will likely be required to be in an office at least a few days a week. While hybrid working has broadened apartment residents’ search for housing, San Jose remains a desirable place to live, and overarching trends support strong rental housing demand. Investors have maintained interest in the market, and transactions continue to close. Pricing in San Jose continues to be at one of the highest levels in the nation.
Vacancy

Net absorption currently stands at 680 units, compared to the long-term average of 3,100 units. Together with an uptick in new deliveries in recent months, vacancy has increased to 5.3%, bringing the current performance in alignment with the metro’s longer-term average and outperforming the national average. Certain submarkets have experienced a bulk of the development activity. For example, submarkets such as Sunnyvale, Mountain View, and Downtown San Jose are growing rapidly, while development has also ramped up in Santa Clara. This could apply future pressure to vacancy and rent growth in these submarkets.
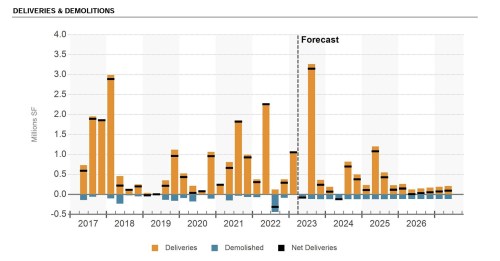
Construction

There are about 8,400 units currently under construction, representing 5.3% of the market’s inventory. Submarkets experiencing the most development activity include Downtown San Jose, Santa Clara, Sunnyvale, and Mountain View. The vast majority of projects are located along the CalTrain route from the Peninsula into Downtown San Jose. Developers have continued to capitalize on the appeal of mixed-use transit-oriented projects, where easy commutes and complementary retail and restaurant uses deliver an attractive lifestyle for residents.
Want to get a deeper look into the South Bay Multifamily Market? Download the full Market Report here.
View Our Multifamily Properties Here.
Office
The South Bay office market is facing a challenge, as tech companies, faced with decreasing valuations and tighter availability of capital, are forced to cut costs by laying off staff and cutting back on office space. Investment sales activity has slowed in the past year to about half its long-term average. Continued uncertainty around weak tenant demand, elevated levels of speculative development, and the general economic slowdown present headwinds to both market performance and asset values.
Leasing

An uptick in companies exiting leases or putting space on the sublet market has seen vacancy and availability rise over the past year. As of 2023Q2 vacancy is 13.6% and the availability rate is 19.3%. Vacancy is projected to rise above 14% by the end of 2023 as new speculative space is delivered to the market. Sublease space availability currently stands at 7.6 million SF, an all-time high. Positive net absorption over the past 12 months was-410,000 SF. However, much of this absorption is through new construction of campus buildings for Apple, Google, and Meta in the tech hubs of Moffett Park, Mountain View, Central Santa Clara, and North San Jose.
Construction
San Jose is one of the more active markets in the nation for office development. As of the second quarter of 2023, 7.4 million SF of office space is under construction. Downtown San Jose has the largest share of the current construction pipeline, at around 2 million SF. The weaker economic climate has led some developers to pause activity in Downtown San Jose. One project now on hold is Downtown West, Google’s massive transit-oriented village near Diridon Station. As of the second quarter of 2023, the timing of vertical construction remains under review. Meanwhile, Google continues to build out its campus space, with several projects underway, including Google Landings in Mountain View, and Google Caribbean in Moffett Park.
Want to get a deeper look into the South Bay Office Market? Download the full Market Report here.
View Our Office Properties Here.
Industrial
San Jose’s industrial market is driven by the growth of Silicon Valley’s technology-based economy. Leasing activity in 2023 remains muted, as inflation, rising interest rates, and economic uncertainty impact tenant demand. Net absorption has been negative in 2023 to date; however, vacancy, at 6.2%, remains low in comparison to historical levels. This is primarily due to low levels of new construction and the continuation of the long-term trend to re-purpose older industrial sites for housing and other uses. Strong demand and tight supply have made industrial rents in San Jose among the highest in the nation, second only to San Francisco.
Leasing

Muted tenant demand in 2023 has resulted in negative absorption in the year to date. For flex properties, new leases have been signed across a diverse range of industries including healthcare, robotics, cleantech, and information technology; however, lease sizes are in the smaller range, generally under 20,000 SF. The larger lease deals in the over 50,000 SF range that were being signed for much of the previous year have been notably absent in the past few months.
Construction

Robust demand for logistics and flex properties has increased the attractiveness of these property types and led to an uptick in construction activity. As of 2023Q2, around 3.7 million SF of new construction is underway, which is the highest level of the past 10 years, and compares to the 10-year average of 1.5 million SF. Logistics space under construction amounts to just 890,000 SF, which suggests that the very low vacancy rate for distribution properties will continue. In the R&D segment, the 847,000-SF manufacturing/research facility being built for Intuitive Surgical at 932 Kifer Road in Sunnyvale is the largest project currently underway.
Want to get a deeper look into the South Bay Industrial Market? Download the full Market Report here.
View Our Industrial Properties Here.
Retail
Recessionary economic challenges, tech layoffs, and bank failures are contributing to weaker consumer demand. Consequently, as of 2023Q2 there has been very little expansion in brick-and-mortar retail. Fortunately for owners, the absence of new construction has allowed vacancy to remain relatively low, and net absorption has been more positive over the past 12 months than it was over recent years, led by grocery stores, auto, and fitness-related uses. New construction activity is mainly focused on creating mixed-use urban villages, with residential, hotel, and office uses above street-level retail.
Leasing

Leasing deals that have closed in 2023 are primarily independent retailers, many of which are in categories such as beauty and personal care, fitness, fast food, and restaurants. Falling consumer confidence and competition from nonstore retailing have been ongoing challenges for brick-and-mortar retail, which has also been impacted by a shrinking market. The population of San Jose has been declining since the beginning of 2019, with the trend accelerating during the initial years of the pandemic as workers relocated to more affordable locations. San Jose’s mall properties have been the most successful at keeping their occupancy high, with the mall vacancy rate declining from 6% to 3.5% over the past 12 months.
Construction

As of the second quarter of 2023, the amount of retail space under construction in the market is 180,000 SF, which is below the long-term average. Construction is largely focused on either stand-alone sites for car dealerships or street-level retail as part of larger residential developments. Most new construction activity involves mixed-use urban villages, which have residential, hotel, and office uses above street-level retail. Several of these projects are underway or proposed, and where the project is a redevelopment of an existing retail center, it typically includes a reduction in the amount of retail space, while new mixed-use projects on industrial sites provide a net increase in retail space.
Want to get a deeper look into the South Bay Retail Market? Download the full Market Report here.
View Our Retail Properties Here.
*Source: CoStar


